00:00:00
Hello friends, meet again with you on the Legurless channel. In
00:00:03
this video, we will discuss high school material, namely statistics on group data.
00:00:08
In this video, we will learn first how to make a
00:00:12
frequency distribution table from group data. Later on for the data. friends
00:00:18
, you can look for the link, bro, put it below so friends can
00:00:21
learn from the first video to the last video and as usual, this video
00:00:25
will also have its own playlist for high school students so friends
00:00:29
can learn from the first video to the last later. bro, put
00:00:32
the playlist link on the top right, don't forget to like the video and
00:00:35
also subscribe to the De Gurules channel. OK, let's just talk about
00:00:41
how to make a frequency distribution table from group data
00:00:46
before we continue watching the video. Bro, I want to let you know
00:00:49
that now You can become a member on the Legrules channel. There are three
00:00:53
membership levels that you can get, namely the linear, square and
00:00:57
cubic levels. Of course, each has its own benefits that you can
00:01:00
get. You can become a member by clicking the join button at
00:01:04
the bottom right of the video or the one below. it's on the legurules channel page. Welcome
00:01:09
to join. Before we make it, we have to know first
00:01:14
what this grouped frequency distribution table is. It's a collection of grouped data
00:01:18
, so there are groups in classes that have the
00:01:23
same interval or class length, for example, what do you do, Sis? Examples like Yes, OK, bro, I
00:01:28
have prepared this. Later there will be family planning material discussed, but here there are the class values, then
00:01:33
there is the frequency, so we call this one a class, yes, this is the
00:01:38
first class, the second class, the third class, 4 5 6 and the class k-7. So what's going on? Just
00:01:45
here, the first class is a group, yes. There was a class,
00:01:49
first, second, third, fourth, fifth, sixth, and ketu, each class has
00:01:54
a frequency, but we don't know what the value of the frequency of the 3 is.
00:01:59
Is it all 30, is it all 31 or are we mixed or not? knowing what it is like
00:02:06
secondly, we will know what is called a class limit. Class limits are the
00:02:10
lower end value and the upper end value of a class, then we can say Yes, this
00:02:15
is the lower limit of a class where we have a lower limit, namely
00:02:20
30, 40 and so on. but here we have what is called the upper limit
00:02:27
of the class, which is different from the lower limit and upper limit. We have what is called
00:02:33
the lower edge and the upper limit of the class. Well, the edge of the class is the class limit with
00:02:38
the closest accuracy. Well, if the number here is an integer, then
00:02:42
the accuracy is half of that number yes then we have here the
00:02:47
lower edge is the lower limit Dik 0.5 so here for the lower edge of
00:02:54
this first class later we have here is
00:02:58
29.5 because 30 - 0.5 while the upper edge class then we have
00:03:07
39.5 because 39 + 5 here means the bottom edge of the second class
00:03:12
is 39.5 and the top edge of the second class is 49.5 and
00:03:18
so on. Later if we complete it it will be like this yes we have the
00:03:22
bottom edge of the class And we have the top edge of the class, now the following value
00:03:26
we need to know is the class length, usually referred to as the class width or
00:03:31
class interval, the class length is the difference between the top edge and the bottom edge
00:03:36
, so if we subtract 39.5 - 29.5, we have the class length
00:03:43
for This frequency table is 10 and the length of this class in one table must be
00:03:48
the same. Yes, these 10 must not all be different. If they are different then the table will not be
00:03:53
right. Next, we have the middle value. The middle value is the value that
00:03:57
is considered to represent the class. It is also called the midpoint of the class or The formula for the middle value class average
00:04:02
is the lower limit plus the upper limit divided by 2 so
00:04:08
we have 30 + 39 / 2 like that, then we have here 30 +
00:04:15
39 which is 69 / 2 so if we divide by 2 then we have
00:04:21
the result 34.5 so if we look for all
00:04:25
the middle values We will have values like this Well yes 34.5 44.5 where do you get
00:04:31
40 + 49 / 2 94.5 where do you get from 90 + 99// 2 now we
00:04:40
are just learning How to make Si a frequency distribution table here
00:04:44
you have data, yes there are 100 data, there are 36 60 54 and so on the steps
00:04:51
What is it like for us to do or search for the
00:04:57
frequency distribution table? First, we will determine the data range or
00:05:01
range of data that we have, so from the large amount of data that we
00:05:05
have, we have to look for the largest and smallest data values. Here the
00:05:10
smallest data value is 18 and the largest data is 69, yes, there is no
00:05:15
70 71, there is no maximum 69, so for the data range
00:05:21
we can calculate 69 - 18. We will have 51. Second, we determine the number of
00:05:29
classes. Actually, there are many ways, yes, and you don't have to follow this, there can be
00:05:33
many the class is determined manually, for example we want the class to be 10, that's
00:05:38
fine, but here there is a method or formula, namely the empirical rule of
00:05:43
Sturges that we can use, namely k or the number of classes is 1 + 3.3
00:05:50
*the log of this nn is there's a lot of
00:05:56
data, so if we look for it, the k value of n is 1 + 3.3, times we
00:06:03
have 100 data here, then we multiply by log 10, log 100, then 1 + 3.3. The value
00:06:11
of log 100 is 2, then friends -Friends, can you just tell me
00:06:15
what the value of the log is, then 1 + 6.6 we have 7.6 and we will always
00:06:22
round up so we will get the number of classes, which is
00:06:26
8, if we get the number of classes then we can finally find The length or
00:06:30
class interval is the range or extent of the data divided by
00:06:34
the number. This means that we divided 51 by 8 and we will get the result
00:06:42
6.375. Later we will take the odd one, which means odd, bro, so
00:06:47
we round it to an odd number so that the middle value is good enough,
00:06:52
right? there's a comma then here we have the value we take 7uh If it's
00:06:57
sixth, it's okay. No, it's okay, actually okay, okay, let's move on to the
00:07:01
next stage. Next stage, we will determine the classes
00:07:05
with the minimum value being in the first class and the maximum value being in
00:07:09
the first class. Finally, yes, then we will fill in the classes with
00:07:12
data values using Turus, we will teach you later. Well, here we already know
00:07:16
that the range is 51, the number of classes is 8 and the length of the class or the width of the class is 7,
00:07:22
which means from the data that we created earlier, if we create the class here we
00:07:26
can do this, for example, if you want the lowest value to be the minimum data,
00:07:30
you can also, for example, if it is 18, that means with a length of class 7, it will eventually
00:07:36
reach 24, yes, 18 19, that means if we calculate 18 19 20 21 22 23 24, that will be the edge
00:07:49
or upper limit. there are 24, then just add 7 so it's easy, friends, that
00:07:54
means 18 + 7, then 25, then add 7 more, 32 3 9 46 53 60 and 67,
00:08:06
so just add 7, for simplicity, the upper limit is also the same, just
00:08:11
add 7, then we have 31 38 45 52 59 66 and
00:08:22
73 and so on. What we have to do, what we do next
00:08:27
is calculate with Lus, so for example, here there is data 36 Oh, 36 is
00:08:32
in that class, that's here, OK, then 60 60 is in that class,
00:08:37
which way? here yes 54 54 is the class in Which one is Here and so on later
00:08:43
we will get something like this now we will get the data,
00:08:49
we have calculated it, we enter it so we can calculate
00:08:53
the frequency, which means here the frequency we have is 14, OK, this is it
00:08:57
there are 5, right? 5 + 5 10 + 4 14 this means 13 5 + 5 + 4 14 again 5 + 5 + 5 +
00:09:08
5 + 3 then we have here 23 5 + 5 + 3 5 + 3 we have 18 5 + 5 + 1 we
00:09:17
have 11 5 + 1 we have 6 and we have 1 Well later when we have this
00:09:24
then we can process the data we can find the min we look for the median
00:09:27
look for the mode and so on we will learn in the next video Yes well but before
00:09:31
going to the next video Let's try one more question for the friends to practice. I'll
00:09:36
give you some time first. You can pause the video. Later, friends, you can try
00:09:41
to copy it. Later, we'll discuss it when you've finished.
00:09:53
OK, you've paused. You can play the video again. Later, friends, you can check
00:09:56
the answers. Friends, is it correct or not? We follow the steps above. First,
00:10:01
we determine the data range, which means we look for the maximum value and
00:10:05
look for the minimum value. The maximum value is 99 and the minimum value is 34. There is
00:10:10
nothing lower than 34 and nothing higher than 99
00:10:14
so we have a data range of 99 - 34, namely 65 UN can be our data range
00:10:21
determine the number of classes, because coincidentally the data are both 100. Later
00:10:25
the number of classes will be the same as in the previous question, namely 8 because
00:10:30
the formula is 1 + 3.3 in the log of 100 then we determine the length of
00:10:37
the class. For the third stage, then the length of the class is the range, namely
00:10:42
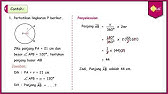
65/ 8 8.125, we take 9, so we
00:10:48
round up too, so if that's all we have to do, bro, make
00:10:53
the class score from 30 to 38. Yes, you want it to be from 31 to 39, you can want it to be
00:11:00
from 32 to 40, the important thing is, OK? The minimum value is in the
00:11:05
first class and the maximum value is in the last class. If we look at
00:11:10
this, just add 9, then add 9 to determine
00:11:15
the lower limit and upper limit so that it is easy. If it is already done, we just need to enter
00:11:21
78 into it. where 78 goes here, 48 goes where 48 goes here and
00:11:27
so on, later we will get the data like this. Well yes, class 30 to 38
00:11:34
there are three data 4 39 to 47 Brother has 4 data 48 to 51 there are 6, there are 11,
00:11:43
then here if we calculate 5 10 15 20 25 26, we have 5 10 15 20 22,
00:11:52
this is also 22 and what we have here is 6. So, to check whether you
00:11:56
are correct or not, you just have to add them up. Yes, the number of these frequencies,
00:12:00
if we add them up, will be the same as There's a lot of data. If we add this all
00:12:04
up it's 100, so that's something like that for this video,
00:12:08
how can we make a frequency distribution table from single data
00:12:14
to group data, thank you friends who have
00:12:18
watched this video. Happy learning. friends, feel this video is useful.
00:12:22
Come on, share it with other friends so that more people can
00:12:25
feel the benefits of the legurless channel. don't forget to like the video, subscribe to
00:12:29
the legurless channel and also follow legurless's Instagram. Thank you
00:12:32
, see you in the next videos